Incidents
Made Explorable
Discover the why by visually exploring who, what, when, where & how.
Keshif’s exploratory analytics technology turns incident data —actors, locations, timing, factors, and outcomes— into rich dashboards where you interactively uncover both the big trends, and the individual events.
Actionable incident trends that inform safety and policy
We know accurate and in-depth understanding of what’s going on locally is critical to identifying and addressing threats to stability and well-being of citizens. Our human-in-the-loop visual intelligence process helps analysts discover emerging trends and clusters, and understand intricate correlations between actors, hot-spots, facts, and outcomes.
Visualize and discover answers. Interact and ask new questions.
Our exploratory analysis technology doesn’t just help answer targeted questions. It also helps uncover new questions by visually revealing unexpected trends and context. With our dashboards, decision makers can easily differentiate between various factors and outcomes of incidents, and drill-down to gain new knowledge from clusters down to specific events.
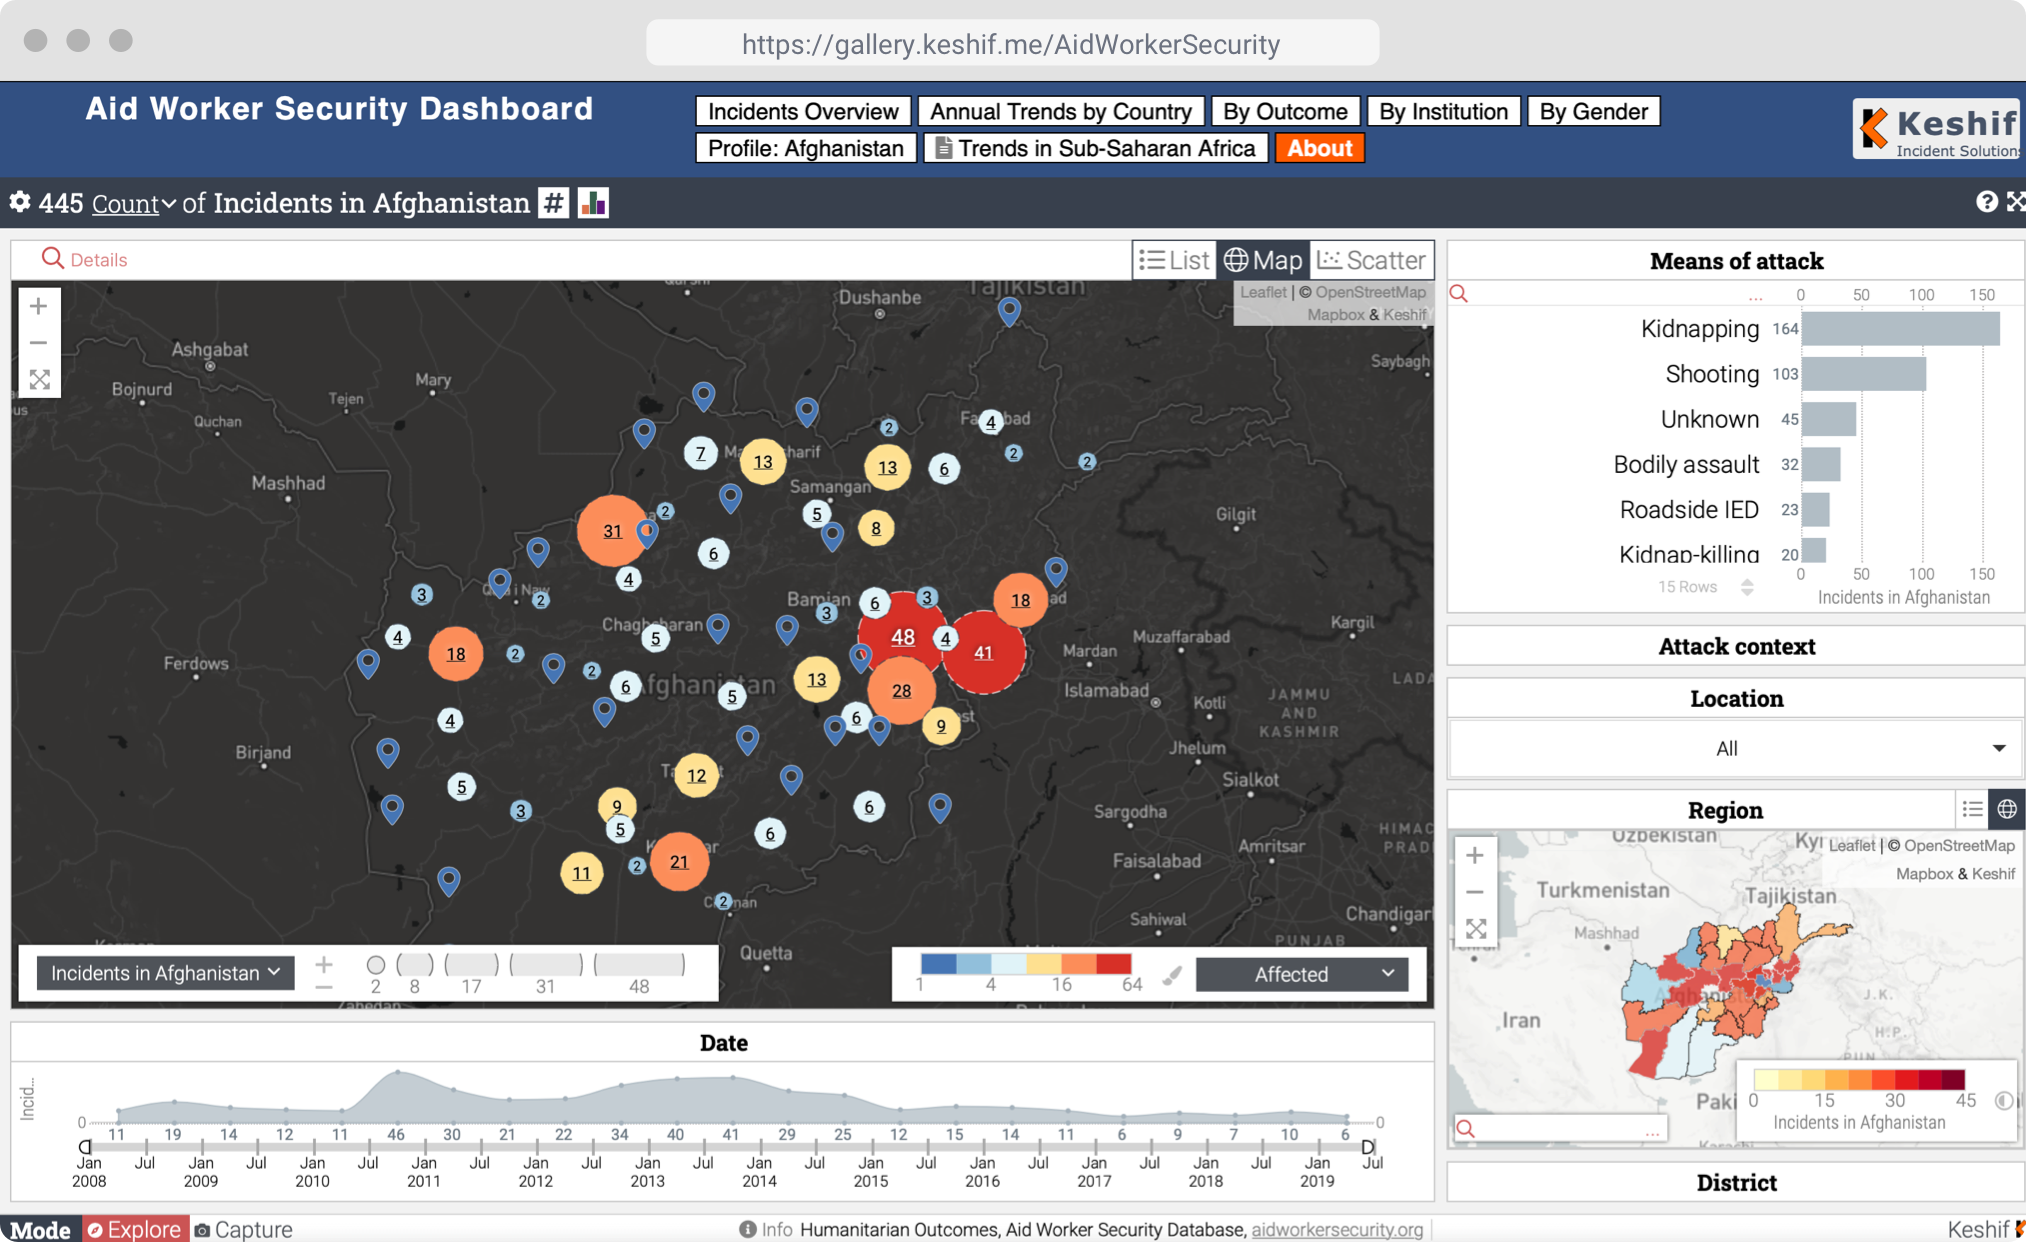
Discover hot-spots in point locations. Zoom in and discover more with dynamic, responsive maps.
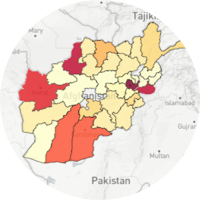
Reveal impact numbers and event frequencies across regions, states, districts in interactive choropleth maps.
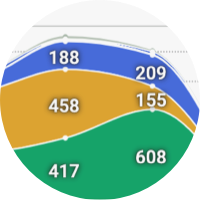
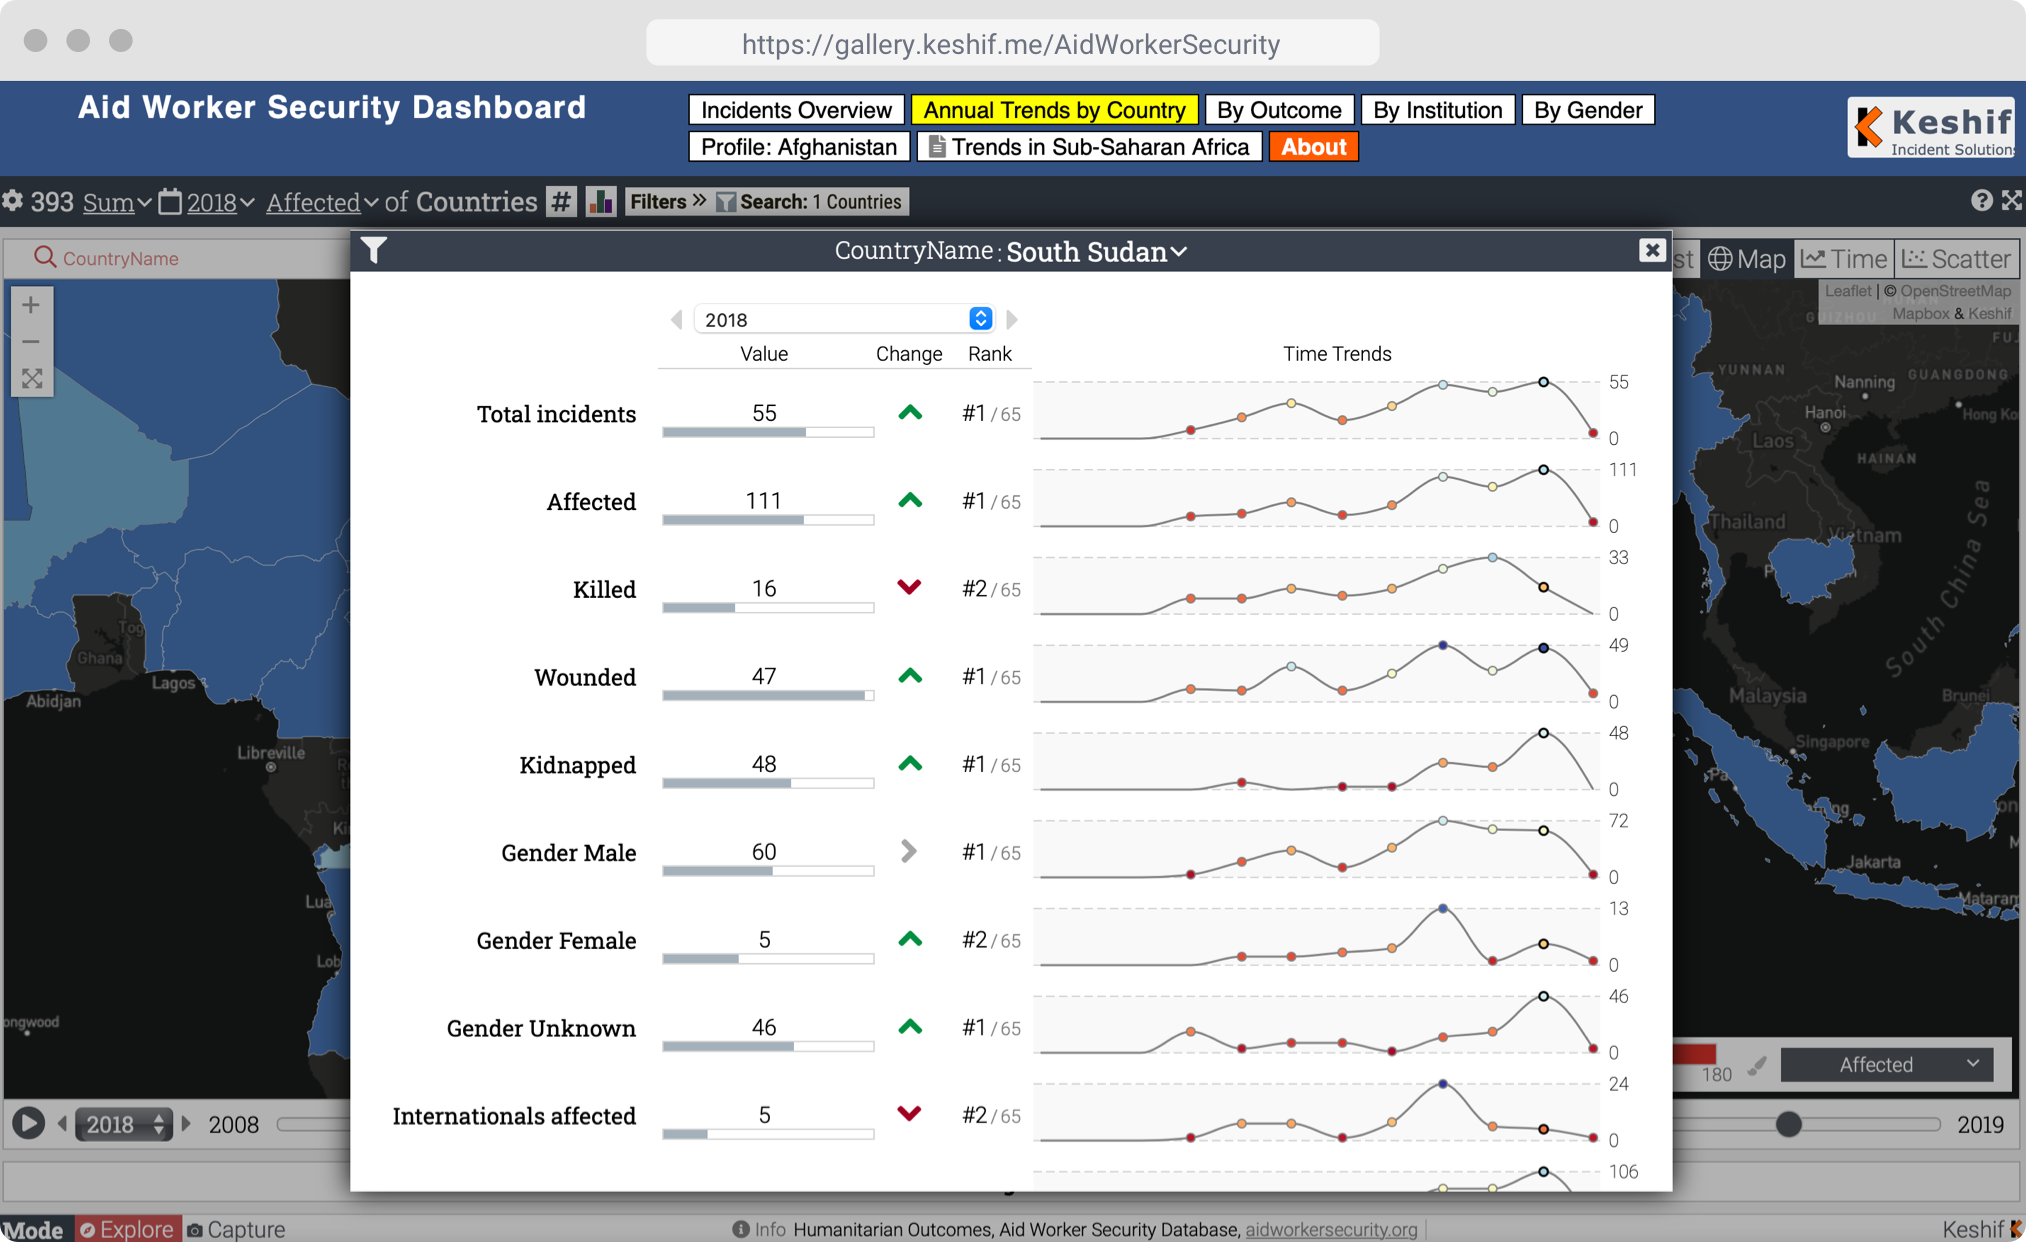
Transform individual incidents to aggregated time trends for analysis with our indicator solutions.
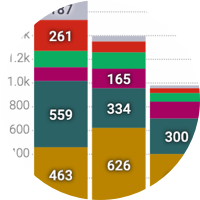
Instantly compare and differentiate trends across factors, actors, & outcomes with a single click.
Incidents from any data source & format
Our solutions can ingest thousands of incidents from external databases and APIs (e.g. ACLED, GTD), project-specific surveys, media platforms, and local data files.
Incidents any time, anywhere, any variety.
Our visual analytics technology adopts to existing data features, whether it is by location, time, or actors, types, or impact information
Data collection with tailored methodologies
We can create tailored methodologies, data collection and management solutions that produce new, reliable sources of incident data
Access insights with public or private apps
Our secure web applications can be accessible publicly for broad dissemination, or privately for analysts working with sensitive data.
Selected Projects & Partners
View all projects
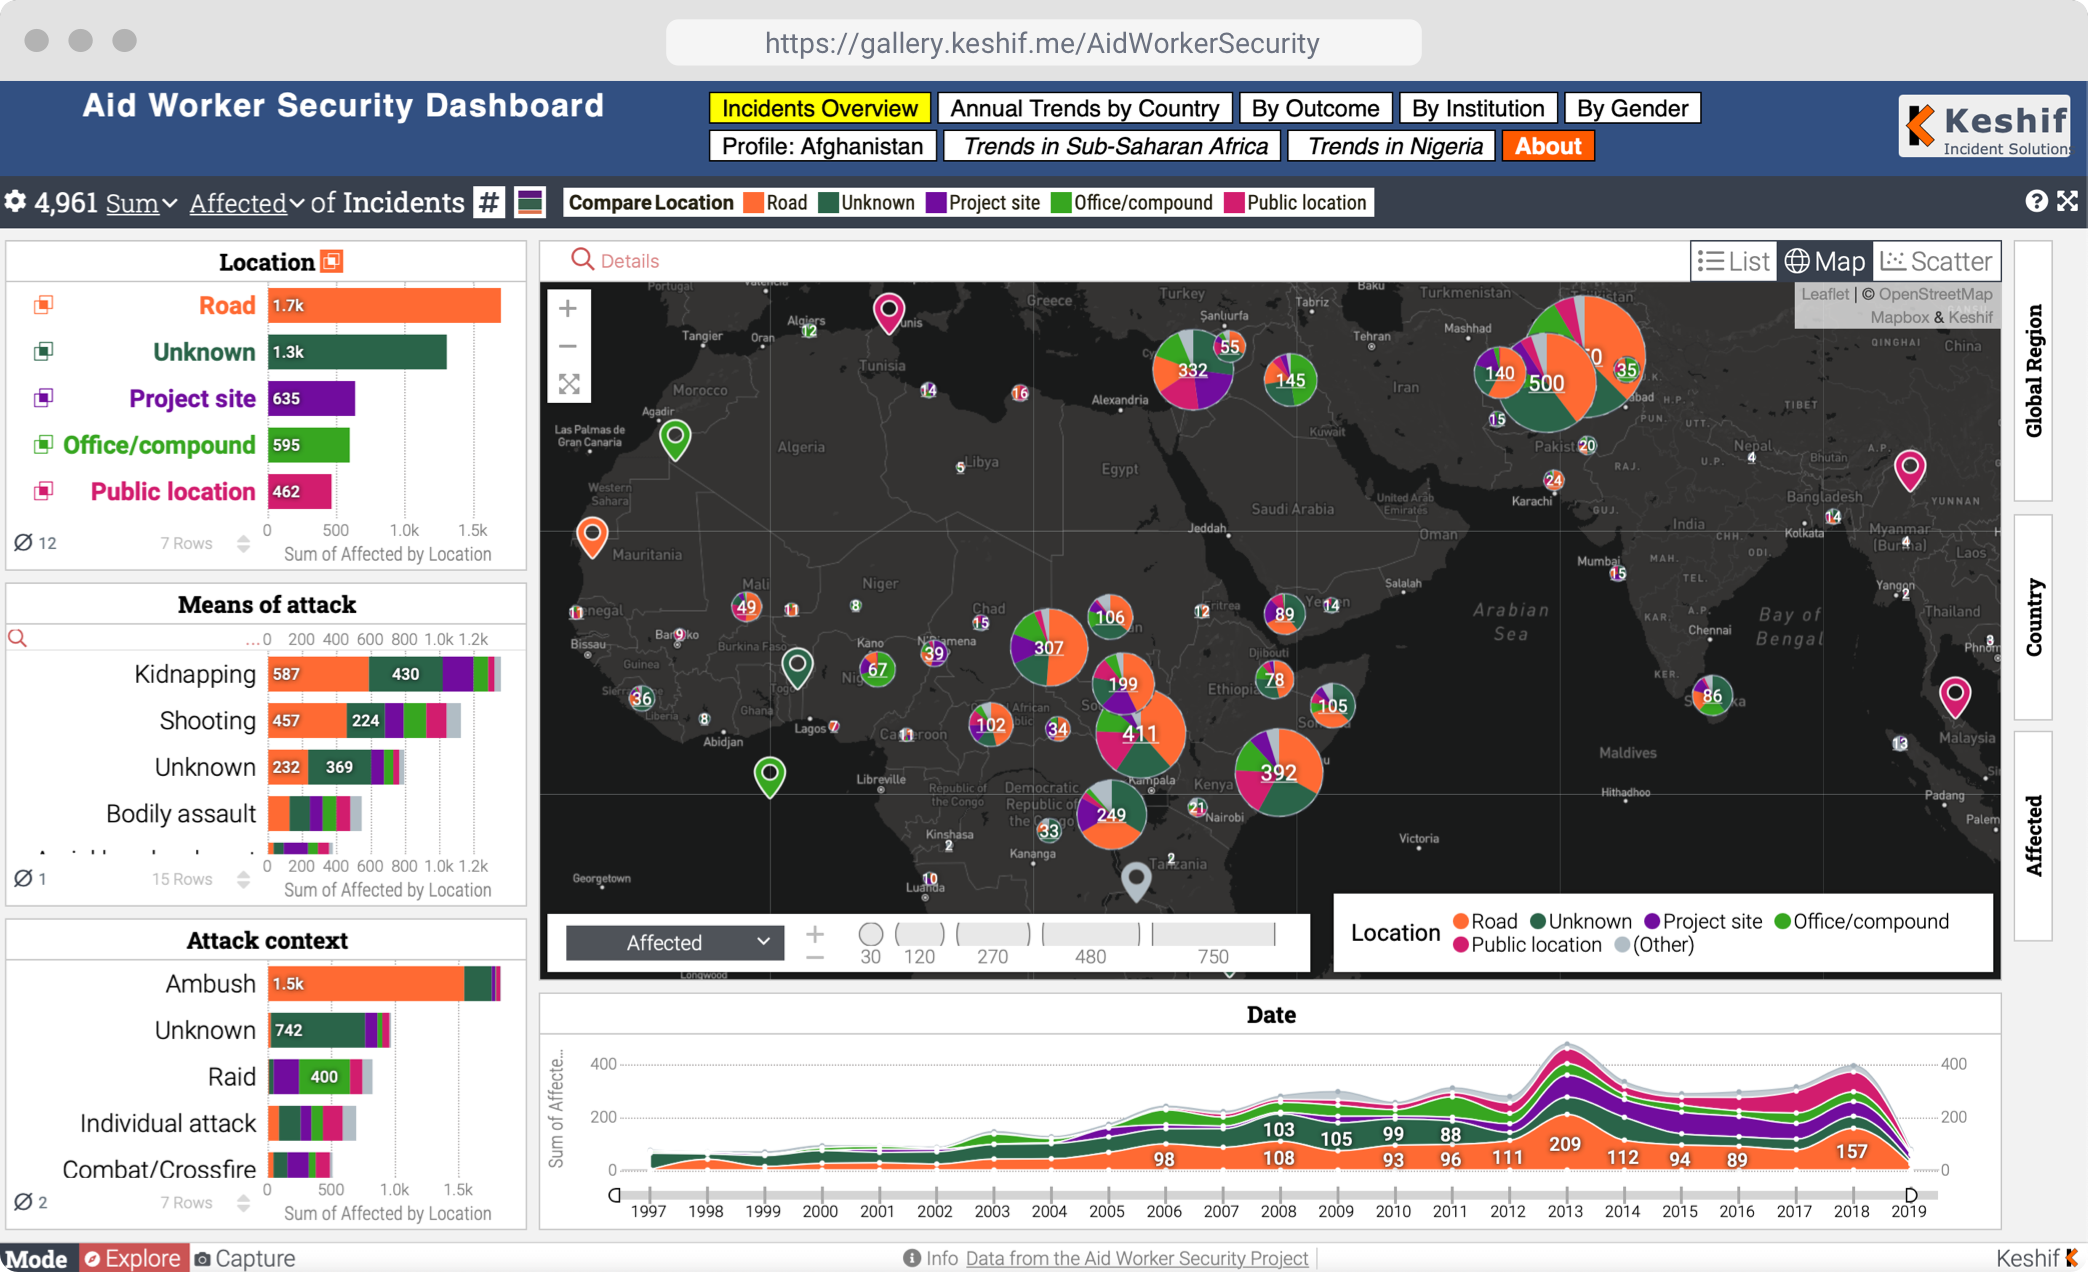
Exploratory Analysis Platform for Attacks Against Aid Workers

Democracy Plus
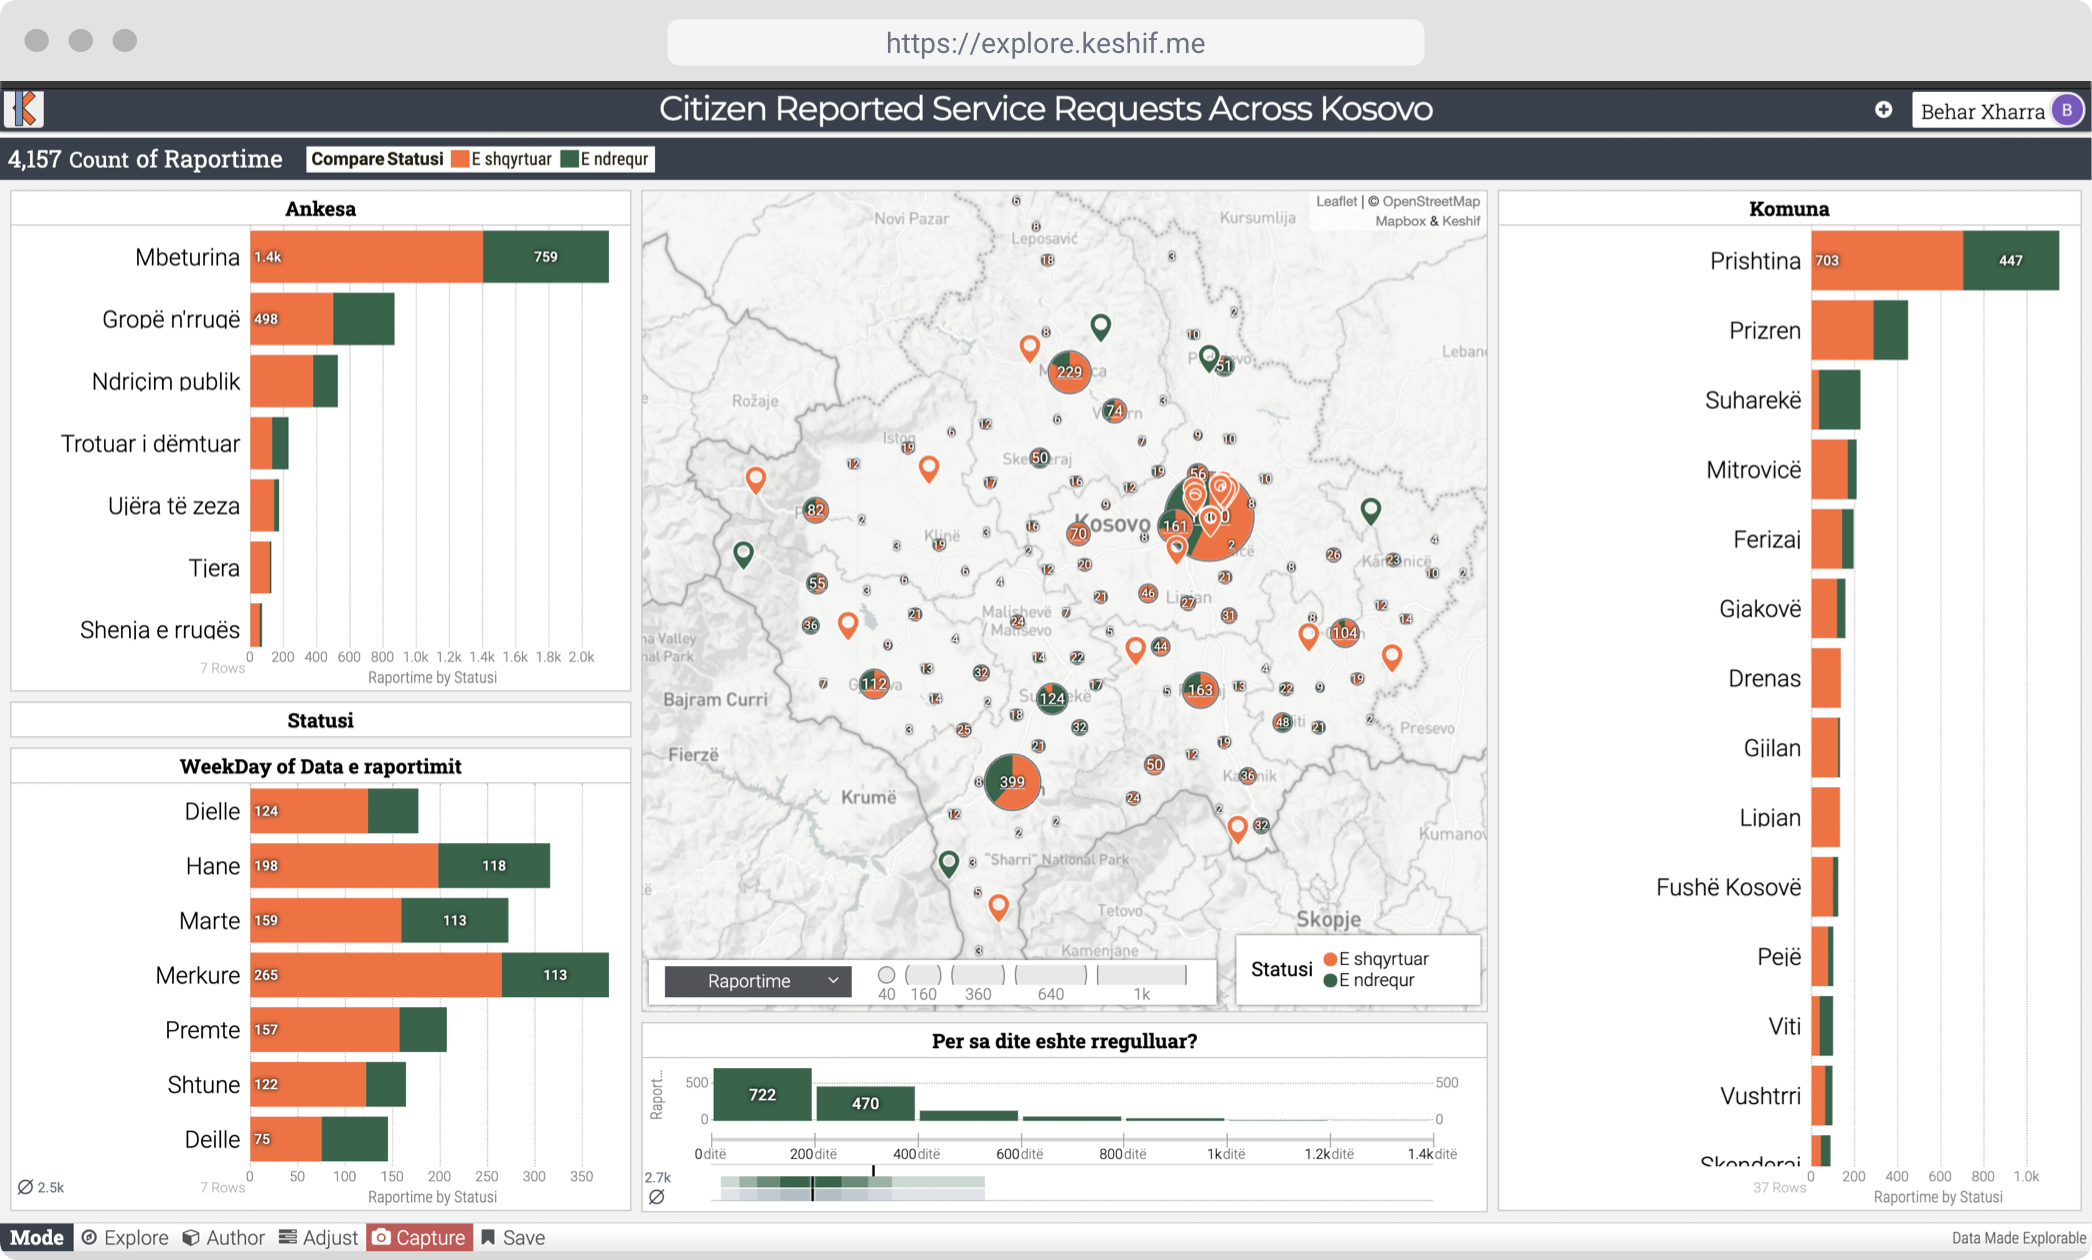
Insights from Citizen Request and Government Response Data in Kosovo

United Nations Resident Coordinator’s Office
Benchmarking Development Risks in Cambodia