Visualizing Civil Society Sustainability Worldwide
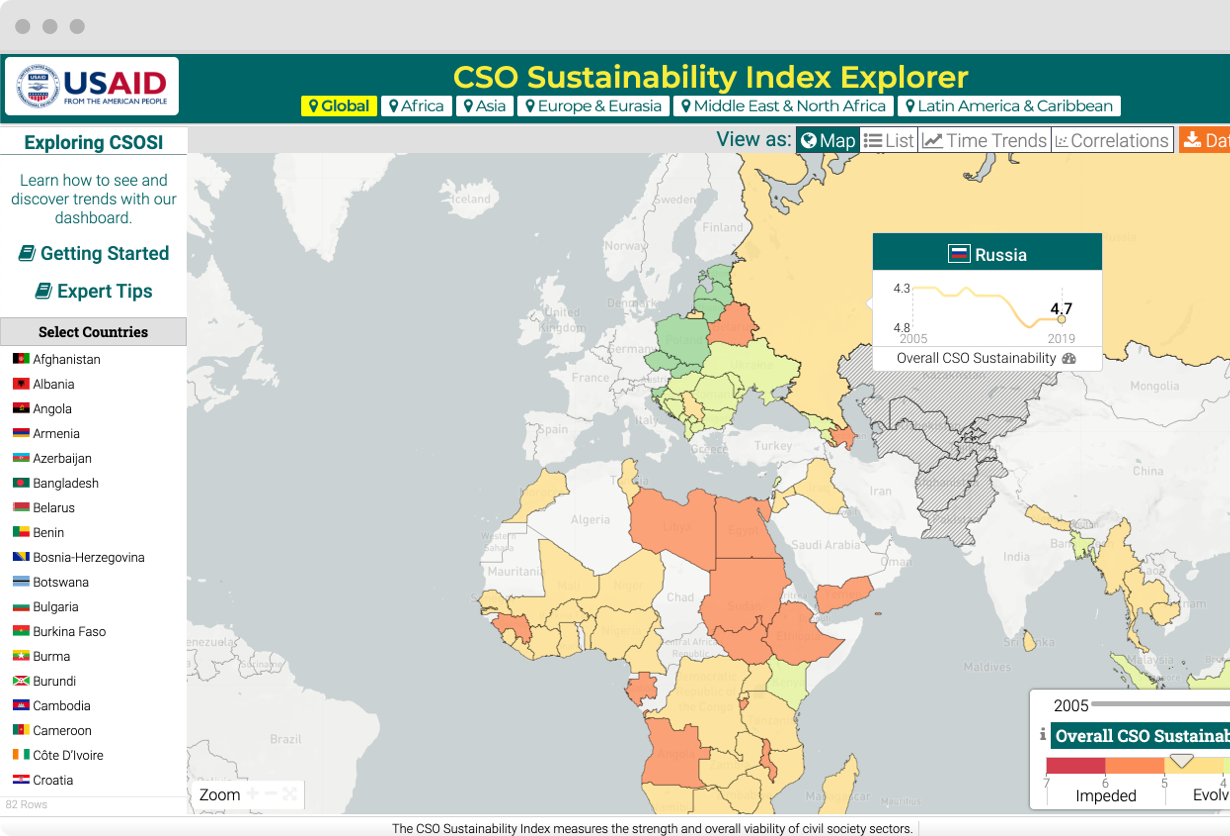
Keshif created an interactive website with rich data visualizations for the Civil Society Organization Sustainability Index (CSOSI). The solution enables in-depth analysis and comparisons of seven indicators on the conditions of civil society organizations around the world.
 |  |
|
|
|
|

Impact
The CSOSI project by FHI360 and USAID publishes indicator data and assessments for civil society sustainability annually, sourced from subject matter experts in each country. Using our solution, CSO advocates, development partners, and academics can instantly access assessments on the strength and viability of the CSO sector in 82 countries, measured among seven dimensions: legal, finance, advocacy, capacity, service, infrastructure, and public perceptions. Specifically, the users can track progress, spot trends, and understand how civil society organizations have fared across countries, indicators, and years, and use this information to drive local, regional, and global research and policy.
82
COUNTRIES
15
YEARS OF DATA
8k+
SCORES
Visual Exploration & Discovery
Discover our tech
Present data through regional dashboards that reflect the CSOSI methodology and structure.
Reveal country trends with choropleth maps and instant interaction through country tooltips that show changes over time for a select country.
Analyze the change of scores per country over time, and compare trends across countries within a region.
Access all country-specific data with interactive timelines, annual rankings, year-to-year changes, and published PDF reports in rich country profiles.
View all indicators of a country at a glance, highlighting up/down/steady trends on a single profile page

Services
View our servicesVisual Data Analytics and Dashboarding
We created targeted customizations to the design of the dashboard and country profiles to match the methodology of CSOSI. The dashboarding features are based in Keshif’s technology and design.
Data Preparation
We created data processing scripts to convert raw data in Excel sheets into analysis-ready files for the dashboard and implemented automated processes for annual updates of data and reports.
Web Design and Development
Our web design reflects FHI 360 and USAID’s branding requirements and enables easy access to project content and materials, methodology and regional and country reports.
Other Services
Our design and development process included usability evaluations and iterative development practices, reflecting findings into the final design of the dashboard and the website.