Visualizing Indicators of Information Production and Consumption in Eurasia
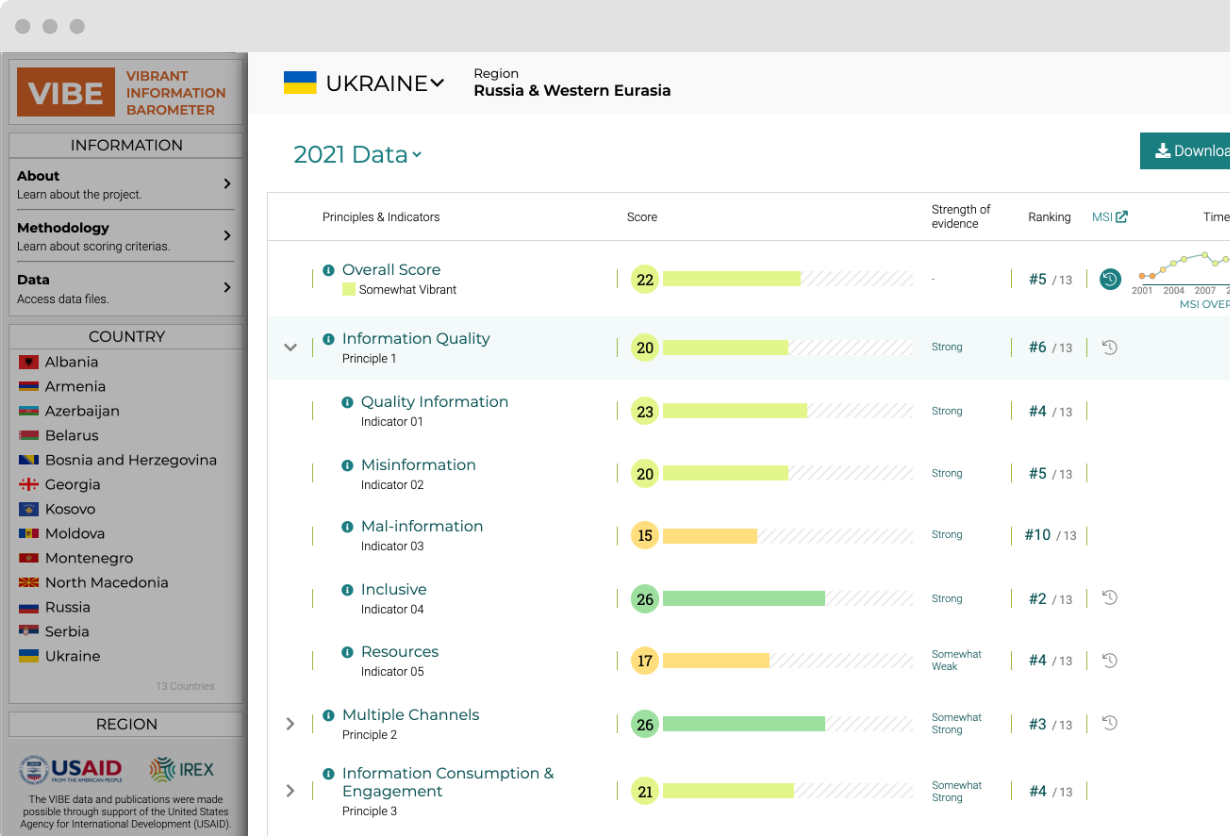
Keshif built an analytically powerful data visualization solution for IREX’s Vibrant Information Barometer (VIBE) - an annual index that tracks and assesses how information is produced, spread, consumed and used across countries in Europe and Eurasia.
 |  |
|
|
|
|

Impact
IREX has developed a proprietary indicator data methodology to assess the information landscape in any given country through subject matter expert panels and qualitative methods. With our solution, IREX and its stakeholders, including policymakers and media professionals, are able to easily understand trends on the flow of information, and diagnose the quality of content for each country it assesses.
24
INDICATORS
300+
SCORES
13
COUNTRIES
Visual Exploration & Discovery
Discover our techAccess country profiles with all scores, rankings, and comparisons to historical MSI data, along with published PDF reports.
Explore data trends geographically, by ranking, or by score correlations.
Navigate, select, and analyze data across 24 indicators.

Services
View our servicesVisual Data Analytics and Dashboarding
We created targeted customizations to the design of the dashboard and country profiles to match the VIBE methodology for hierarchical indicators.
Data Preparation
We created data processing scripts to convert raw data in Excel sheets into analysis-ready files for the dashboard, including integration of historical MSI data to VIBE methodology for longitudinal comparisons.
Web Design and Development
Our web design reflects IREX and USAID branding requirements to enable easy interaction and access to project content, methodology, guiding materials.